WHAT DOES THE GEOGRAPHY OF IMMIGRATON LOOK LIKE ACROSS THE REGION
The Toronto region is considered one of the most diverse in the world with immigrants arriving every day from all corners of the globe.
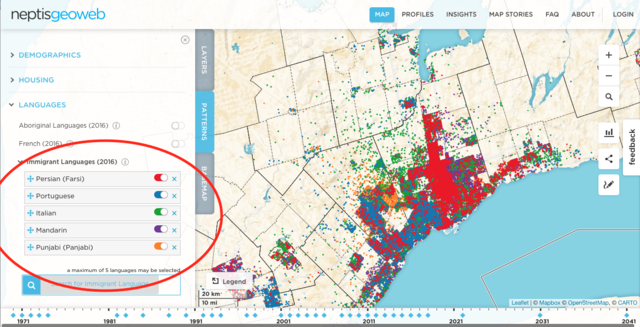
The MAP section of the Geoweb contains census information that allows the user to visualize concentrations of immigrant languages spoken across the Greater Golden Horseshoe. Statistics Canada defines theses languages as “the first language learned at home in childhood and still understood by the person at the time the data was collected.”
Because there are at least 200 different languages spoken across the region, we’ve developed a search tool that allows you to search up to five languages at a time and then map them individually or together. You can temporarily turn off a layer to view each language separately or use the “x” to remove a language from a search and add a new language in the search bar.
While each dot equals 10 speakers of a language, it is worth noting that the location of a dot is randomly generated within a Dissemination Area (DA), a small area identified by Statistics Canada, which contains a population of 400 to 700 persons.
The patterns that emerge from a search of Punjabi and Mandarin show that Punjabi speakers are dominant in Brampton, while Mandarin speakers are concentrated in northeast Toronto, Markham and Richmond Hill as well downtown Toronto and central Mississauga.
Punjabi and Mandarin Speakers across the Toronto region (Neptis Geoweb)
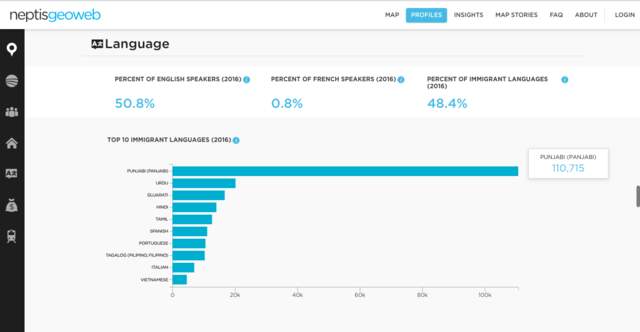
The PROFILES section which contains more than 80 thematic indicators such as household income, dwelling values and labour force status, allows you to see what the top 10 immigrant languages are by municipality or by region. This example shows that Brampton has 110,715 Punjabi speakers which makes up about 19% of the municipality’s population.


Comments