MAPPING THE STRUCTURE OF THE TORONTO REGIONAL ECONOMY
Like many city-regions across North America, the Toronto region continues to reel from the loss of more than 200,000 manufacturing jobs since 2001. These losses, mostly in older industrial areas, are part of a broader transformation of the regional economy and changing employment patterns brought about by globalization and rapid change in technology.
The Geoweb MAP section contains map layers under the Patterns tab that you can turn on and off to visualize where jobs concentrate, where jobs have been gained and lost, and the concentration of industry clusters.
The jobs data on the Geoweb allows you to map both “core” employment and population related jobs. Core employment jobs produce goods and services that can be exported, or that draw income into the region. They are distinct from “population-related” jobs in shops, restaurants, or schools that service the population.
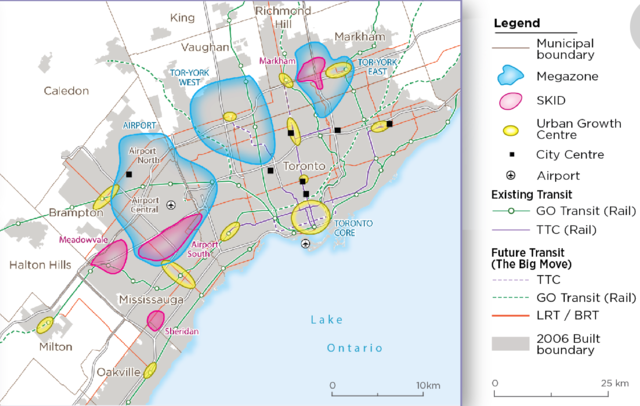
The mapping of the core employment data was a key part of the analysis contained in a 2015 Neptis report, Planning for Prosperity, by Pamela Blais. The analysis outlines an evolving regional economic structure characterized by a very dense Downtown Toronto employment area with 465,000 jobs, as well as three large, and significant multi-jurisdictional suburban employment areas, or megazones.
The biggest of the suburban megazone encircles Pearson airport, another centred on the 404/407 highway interchange, and a third stretches from the intersection of Highways 400 and 407 east to Keele Street and south into Toronto. Together, these three areas account for 450,000 core employment jobs. Meanwhile, downtown Toronto, which has a much smaller geography, accounts for just under 386,000 core employment jobs.
Core empolyment jobs that bring revenue into a region in 2016 (opposite of population-related employment)
Another significant feature of the evolving economic geography of the Toronto region which can be mapped are Suburban Knowledge-Intensive Districts or SKIDs, as identified by Blais. These are concentrated areas of suburban employment, and like downtown Toronto, the SKIDS have attracted a significant share of job growth in knowledge-based jobs and found in Markham, Mississauga, and Waterloo.
Understanding the structure of the regional economy also involves understanding at least two other data sets that can be visualized on the Neptis Geoweb and juxtaposed against other map layers:
Job Loss and Gain: The Geoweb contains data that can be mapped based on the analysis done in Planning for Prosperity. It’s a story of widespread decline of jobs across the Greater Golden Horseshoe (GGH) region between 2001 and 2011. Outside of downtown Toronto, the rest of the City of Toronto saw widespread job losses, along with other older regional city centres such as Brampton, Hamilton, and Oshawa. This data has now been updated to reflect the 2016 census.
Gain and loss in employment between 2006 and 2016
Industry Clusters: The Geoweb also contains mapping data on various industry clusters located across the region. The clusters which range from life sciences to finance and insurance, and advance manufacturing can be found in the Patterns section and are based on groupings identified by Michael Porter, a professor from Harvard Business School, who coined the term “clusters.”
Distribution of finance and insurance industries (2016)


Comments